ChartLense Dashboard for TradingView
You've taken the first step by installing the Dashboard. Now supercharge your TradingView analysis with AI-powered chart analysis in one click.
What is ChartLense Dashboard?
ChartLense Dashboard is a free Pine Script indicator overlay designed specifically for TradingView users. This TradingView Pine Script displays the most important technical indicator information in a clean, easy-to-read table format directly on your charts, enabling faster technical analysis and better trading decisions.
Add directly to your TradingView charts • Free Pine Script indicator
Complete Your Setup (2 Minutes)
Get the Complete Trading Analysis System
✅ Step 1: Dashboard Installed (You're here!)
⬜ Step 2: Get ChartLense Extension - Unlock AI-powered analysis
Why add the Extension?
- Dashboard gathers indicator data → Extension analyzes it with AI
- Get confidence scores and pattern recognition
- One-click analysis instead of manual indicator review
✓ Free daily analyses • No credit card required • Install in 60 seconds
How Dashboard + Extension Work Together
The ChartLense Dashboard Pine Script gathers your trading indicator data from TradingView. The Chrome Extension analyzes it with AI-powered automated technical analysis. Together, they deliver instant, confident trading decisions.
Dashboard Displays
Key indicators organized
Extension Analyzes
AI processes patterns
You Decide
Trade with confidence
With Extension: AI analysis + confidence scores + actionable insights
Key Features
- Real-time Indicator Data - Live updates of key technical indicators for instant trading insights
- Clean Table Format - Organized TradingView indicator overlay that doesn't clutter your chart
- Pine Script Based - Native Pine Script integration for optimal TradingView performance
- AI-Ready Data - Optimized for automated technical analysis with ChartLense Extension
What the Dashboard Shows You
Get instant access to the metrics that matter:
Trend Analysis:
- EMAs 9, 20, 200
- Current trend direction and strength
- Key support/resistance levels
- Pivot Points: former highs and lows of market structure
Momentum Indicators:
- RSI values with overbought/oversold signals
- MACD histogram and signal line
- Bollinger Bands for volatility analysis
- Volume analysis with unusual activity alerts
What Traders Achieve with This Setup
Faster Decisions
Stop switching between 5 different indicator panels. Get all critical data in one glance + AI confirmation in seconds.
Before: 2-3 minutes analyzing indicators manually After: 10 seconds with Dashboard + Extension analysis
Higher Confidence
Never second-guess your setup again. AI confidence scores tell you when your chart is optimized for accurate analysis.
"I used to spend 10 minutes per chart analyzing indicators manually. Now I get better analysis in under a minute with the Dashboard + Extension combo."
Professional Setup
Clean charts. Organized data. Institutional-grade analysis. All without clutter.
- Impress clients with professional chart presentations
- Make data-driven decisions, not emotional ones
- Trade with the same tools used by professional analysts
Dashboard Only vs. Complete Setup
See what you're getting with each option:
| Feature | Dashboard Alone | Dashboard + Extension |
|---|---|---|
| Indicator Display | ✅ | ✅ |
| Clean Table Format | ✅ | ✅ |
| AI Chart Analysis | ❌ | ✅ |
| Confidence Scores | ❌ | ✅ |
| Pattern Recognition | ❌ | ✅ |
| Actionable Insights | ❌ | ✅ |
| Setup Time | 2 min | 4 min |
| Value | Good | Exceptional |
→ Unlock Full Value:
The Dashboard organizes your data, but the Extension turns it into actionable trading insights.
Ready to Complete Your Setup?
You already have the Dashboard. Add the Chrome Extension to unlock AI-powered analysis.
Get ChartLense Extension (Free)
✓ What you get:
- Free daily analyses
- Works with your existing Dashboard
- AI confidence scores
- Pattern recognition
- One-click chart analysis
✓ Quick setup:
- Install in 60 seconds
- No credit card required
- Works on all TradingView plans
- Free daily analyses (resets at midnight UTC)
Dashboard Configuration
This Pine Script indicator can be positioned in two different locations on your TradingView chart to fit your trading setup preferences:
Left Configuration
The dashboard displays as a compact table on the left side of your chart, providing easy access to key indicators without obstructing your price action view.
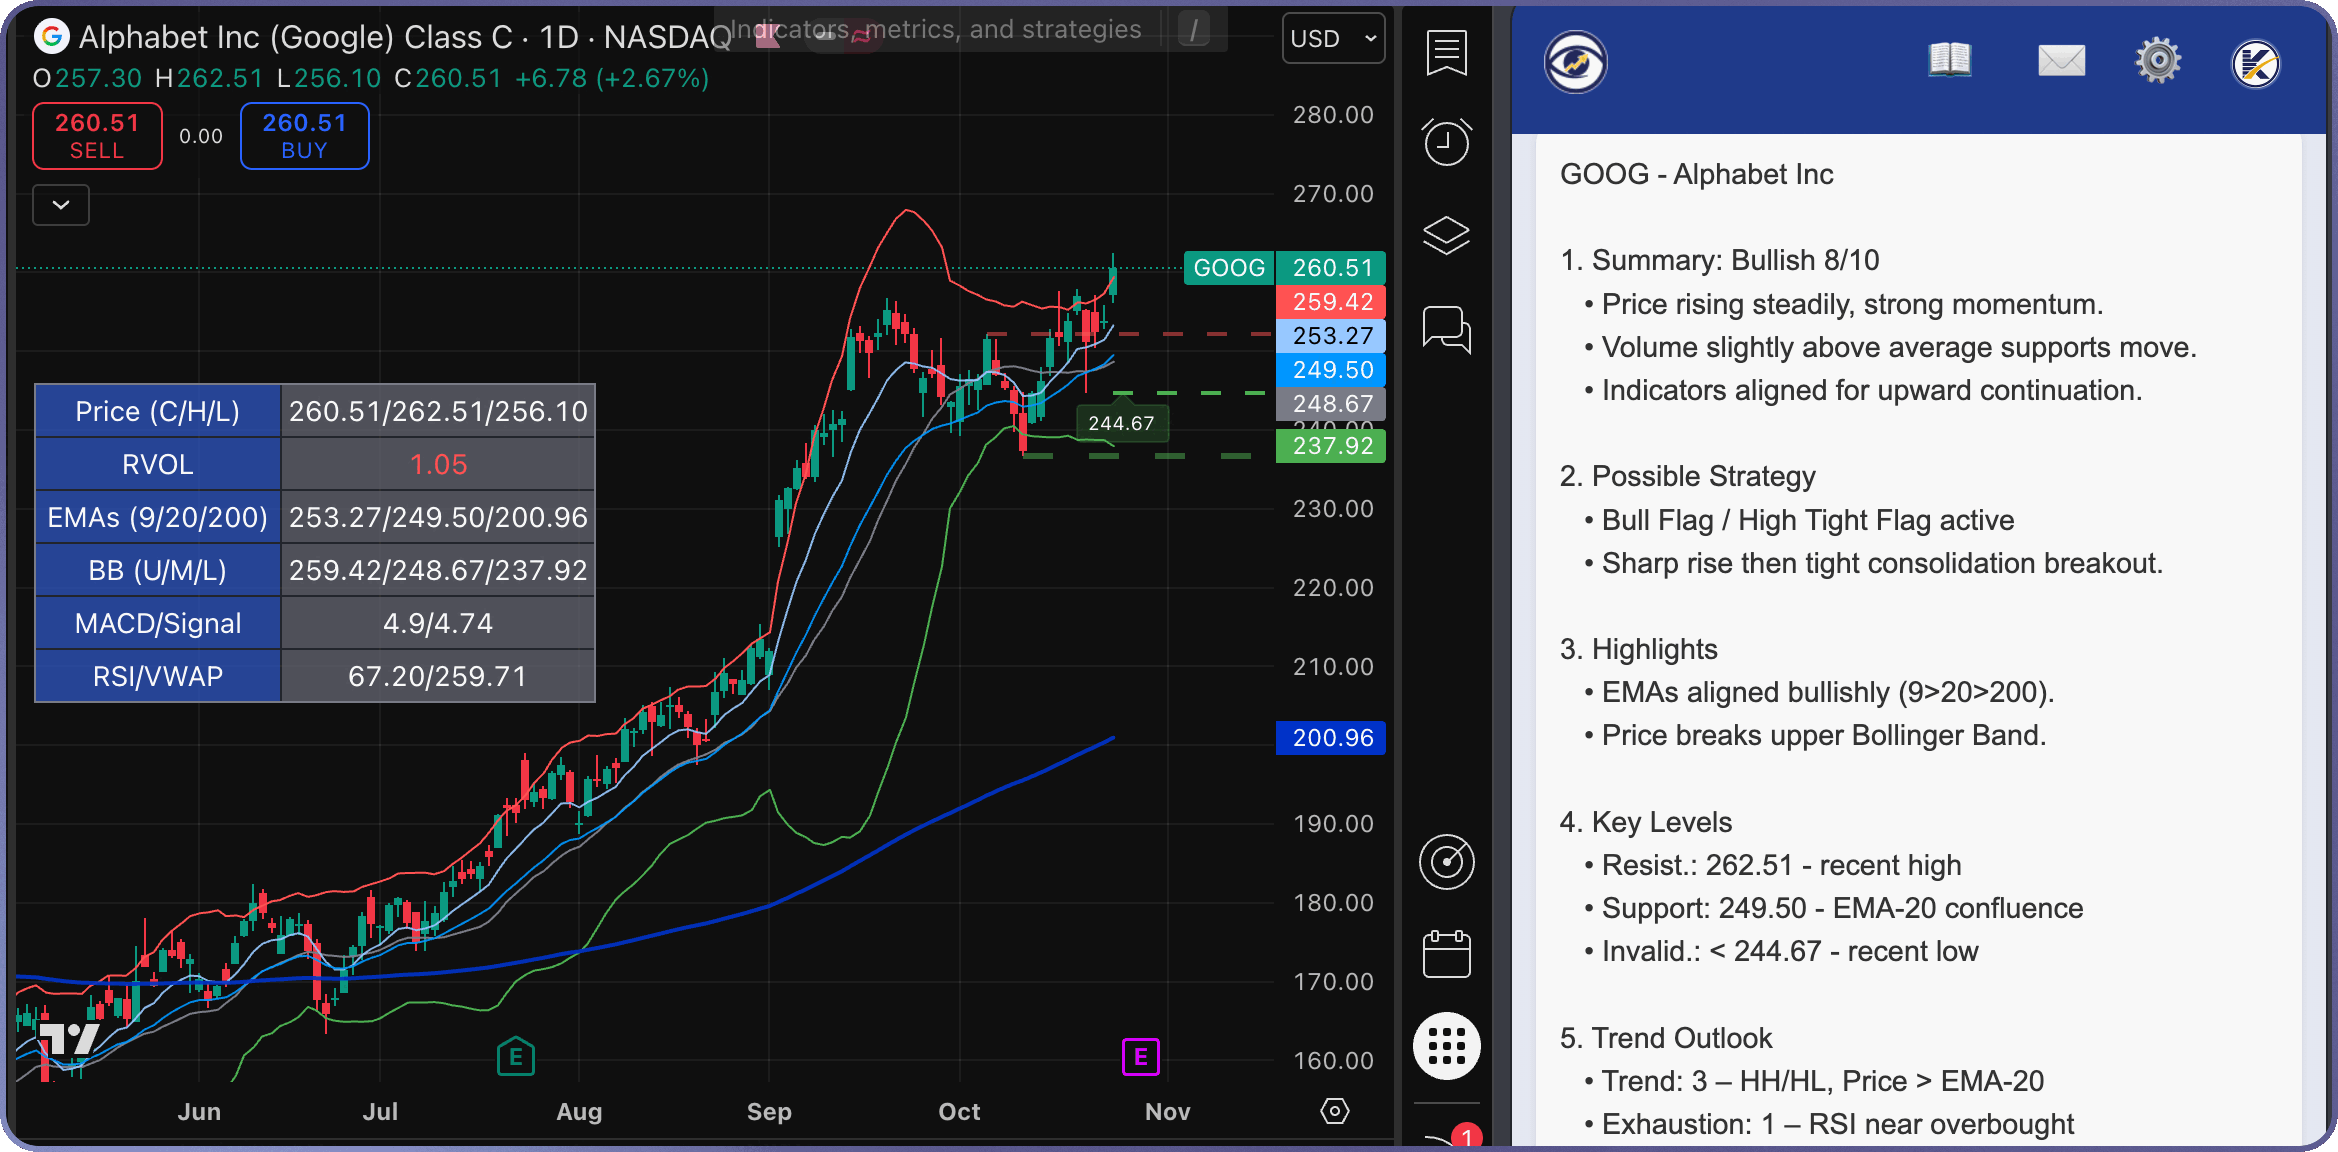
ChartLense Dashboard (left) + Extension (right) - Complete integrated analysis system
Bottom Configuration
The dashboard displays as a horizontal table at the bottom of your chart, offering a wider view of indicator data while maximizing vertical chart space.
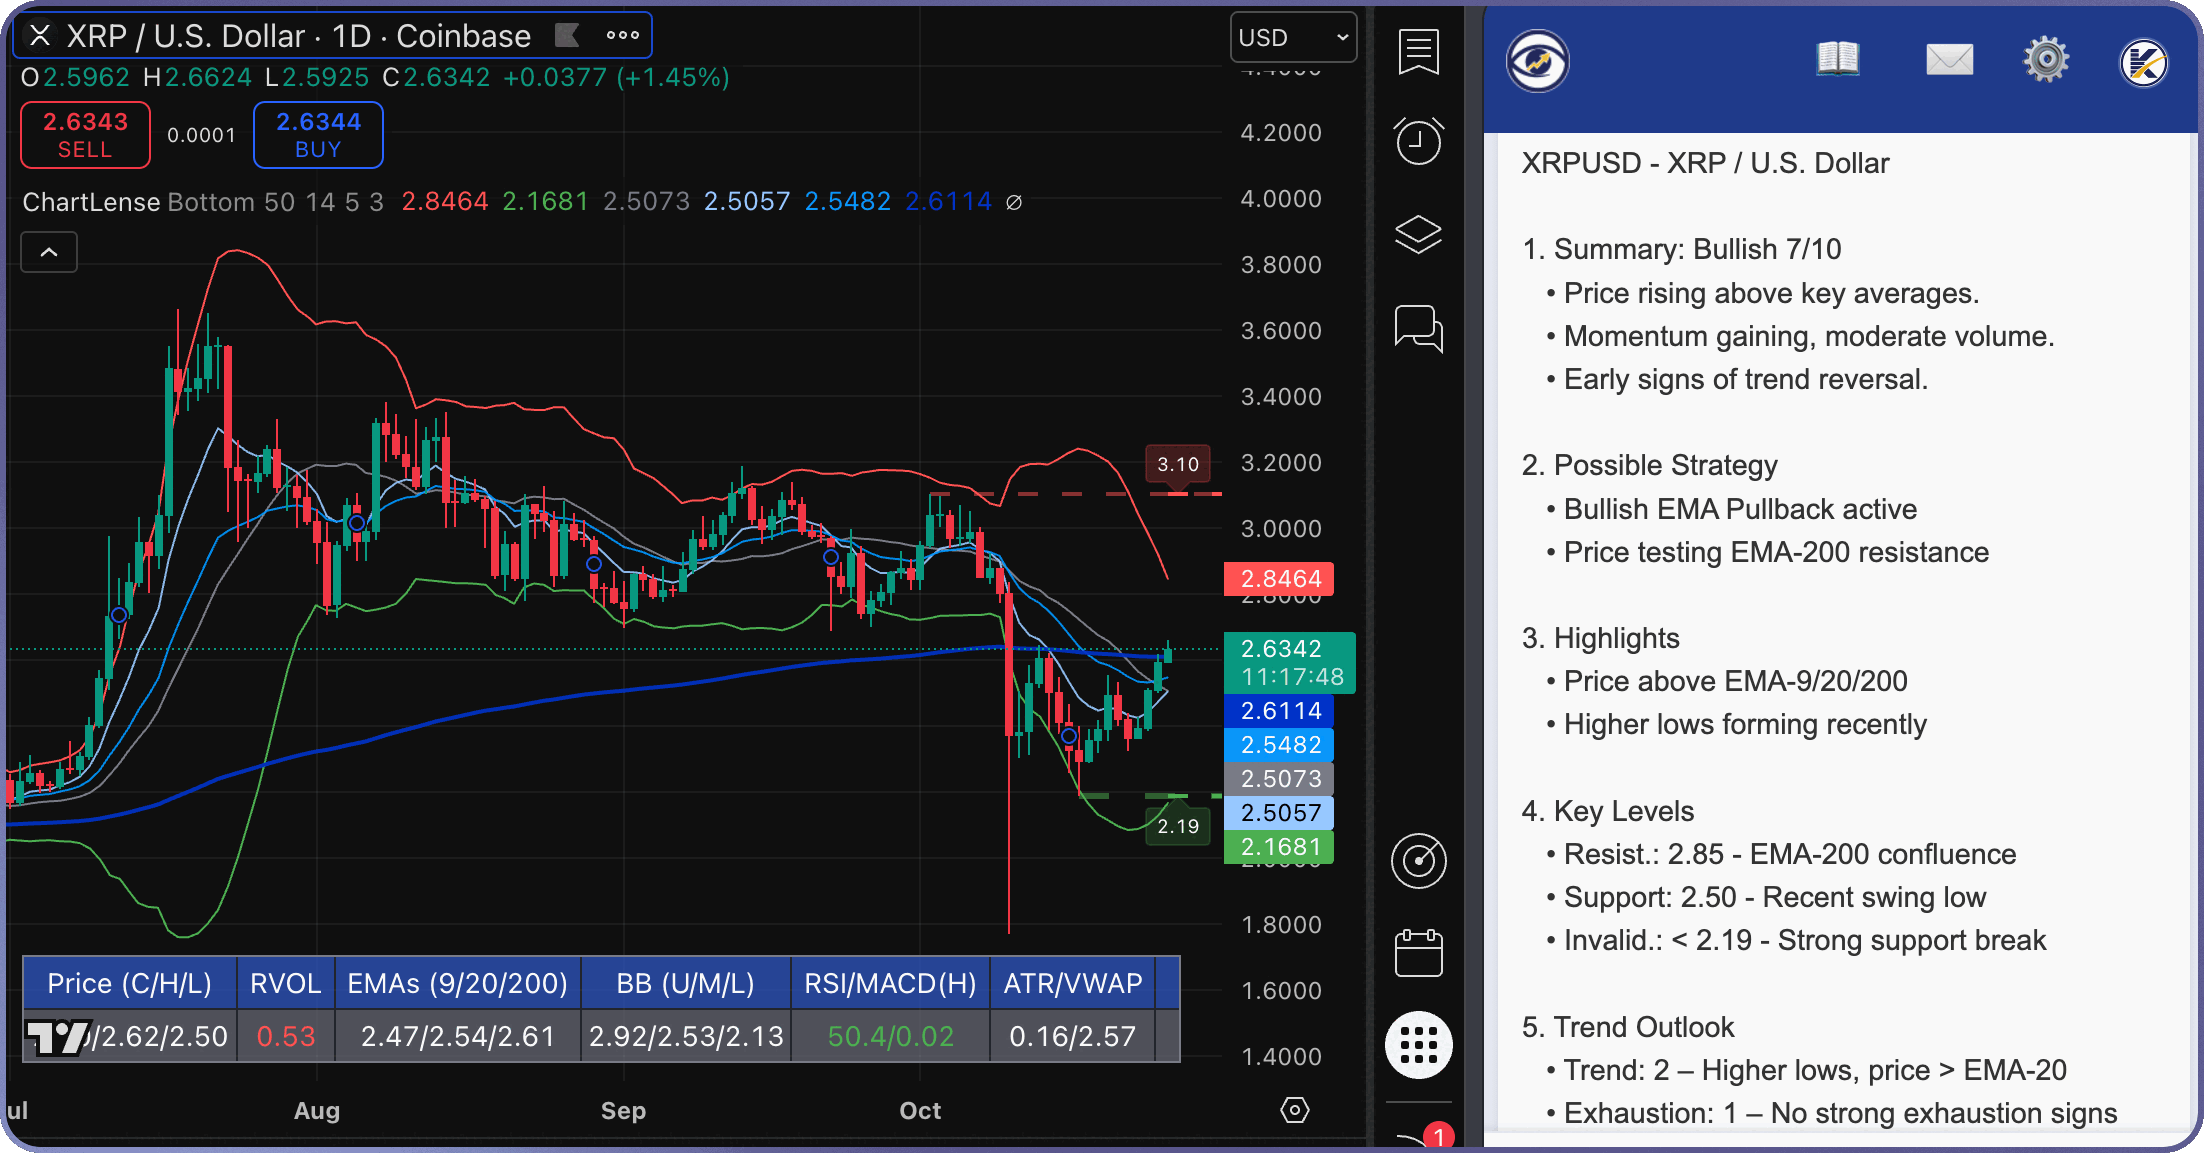
ChartLense Dashboard (bottom) + Extension (right) - Complete integrated analysis system
Changing Configuration: You can switch between Left and Bottom positioning in the Pine Script indicator settings within TradingView's dashboard configuration menu.
Works Perfectly with Extension: Both configurations provide the clean, organized data that the ChartLense Extension needs for accurate AI analysis. Choose the layout that fits your trading style.
Next Steps
1. Install ChartLense Extension - Complete your setup (60 seconds)
Transform your Dashboard data into AI-powered insights with one click.
2. Learn How to Use ChartLense - Quick start guide (5 minutes)
Watch demo videos and learn best practices for getting the most accurate analysis.
3. Understand AI Confidence Scores - Maximize accuracy
Learn what affects analysis quality and how to set up your charts for high-confidence results.
4. Need Help?
Visit our Support Page or check the Troubleshooting Guide for common issues.
Already installed the Extension? Jump straight to Getting Better Results to optimize your chart setup.
Support
ChartLense Dashboard Pine Script is designed to work seamlessly with the main ChartLense extension for AI-powered trading chart analysis. For the best automated technical analysis experience, use both tools together on your TradingView charts.