Understanding Your Chart Analysis
ChartLense provides a detailed, structured report to help you quickly understand the technical landscape of any chart. This guide breaks down each section of the analysis.
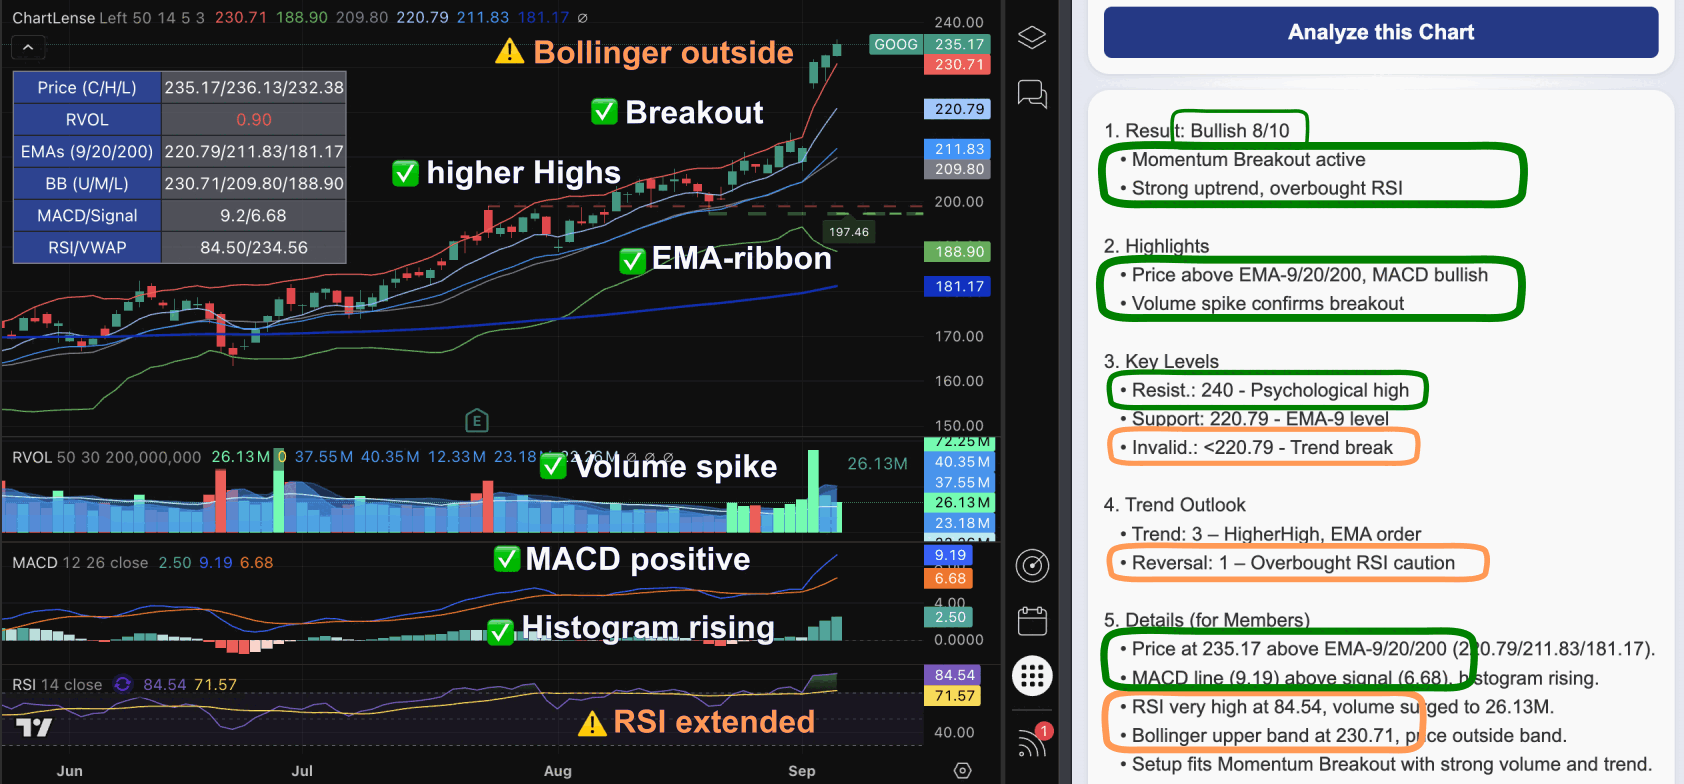
An example of a ChartLense analysis report.
An Overview of the 5 Report Sections
Your analysis report is composed of five main sections, designed to give you a complete picture from a high-level summary down to the fine details.
- Result: The main conclusion, including the overall bias (Bullish/Bearish) and a 0-10 confidence score.
- Highlights: The two most important reasons why the analysis reached its conclusion.
- Key Levels: The critical price levels to watch for support, resistance, and invalidation of the setup.
- Trend Outlook: A scored breakdown of the trend's strength and any signs of reversal risk.
- Details (Subscribers only): A narrative summary that connects all the data points.
A Deep Dive into the Scoring System
The 0-10 score is one of the most powerful features of the analysis. It is not arbitrary; it is calculated based on a systematic, multi-factor model.
The Score Meaning
Here is a general guide to what the scores mean:
| Score | Label | Meaning |
|---|---|---|
| 9–10 | Textbook Setup | All conditions align for a high-conviction setup. |
| 7–8 | Strong Setup | Most signals confirm, but minor risks exist. |
| 4–6 | Moderate Setup | Some positive signals, but confirmation is needed. |
| 1–3 | Weak Setup | Few signals align; there is a high risk of failure. |
| 0 | No Setup | Nothing aligns, and no clear strategy is present. |
The Components of the Score
The final score is calculated from a Core Score and Conviction Points. The Core Score itself is derived from four sub-scores:
- TrendScore (0-3 points): Measures the strength of the current trend using price action (higher highs/lows) and key indicators (EMAs, RSI).
- VolumeScore (0-2 points): Awards points for strong volume confirmation, a sign of institutional activity.
- CatalystScore (0-2 points): Looks for specific catalysts like a textbook candle shape or a breakout from a consolidation pattern.
- ExhaustScore (0-3 points, subtracted): This is a risk score that penalizes the setup for warning signs like RSI divergence or long wicks on candles, which suggest the trend may be running out of steam.
Detailed Breakdown of Other Report Sections
2. Highlights
This section provides the core evidence for the analysis. It answers the "why" behind the score and bias.
- Justification: The first bullet point explains the most critical observation that supports the primary pattern.
- Dominant Pattern: The second bullet point describes the main price action or indicator behavior currently in play.
3. Key Levels
These are the most important price levels to watch, derived from the chart's structure.
- Resistance (Resist.): A price ceiling where selling pressure is expected. The price may struggle to move above this level.
- Support: A price floor where buying pressure is expected. The price may bounce off this level.
- Invalidation (Invalid.): The price level that, if broken, would negate the current analysis. For example, if the analysis is Bullish, a break below the invalidation level suggests the bullish case is no longer valid.
5. Details (Pro Members)
This is a summary for Pro users that synthesizes the findings into a brief, actionable narrative. It provides additional context and condenses the technical observations into a concluding thought, helping you connect the dots between the different parts of the analysis.
Want More Control Over Your Analysis?
While ChartLense provides comprehensive default analysis, you can customize exactly what the AI focuses on using Expert Prompts. Tell the AI to analyze specific indicators, trading patterns, or strategies—perfect for traders who want laser-focused insights tailored to their approach.
Example: Instead of a general analysis, you could ask: "Focus on RSI divergence and MACD momentum. Assess reversal probability and provide 2 supporting signals."