ChartLense Dashboard
Enhanced TradingView experience with key indicator data at your fingertips.
What is ChartLense Dashboard?
ChartLense Dashboard is a Pine Script-based table overlay designed specifically for TradingView users. It displays the most important indicator information in a clean, easy-to-read format directly on your charts.
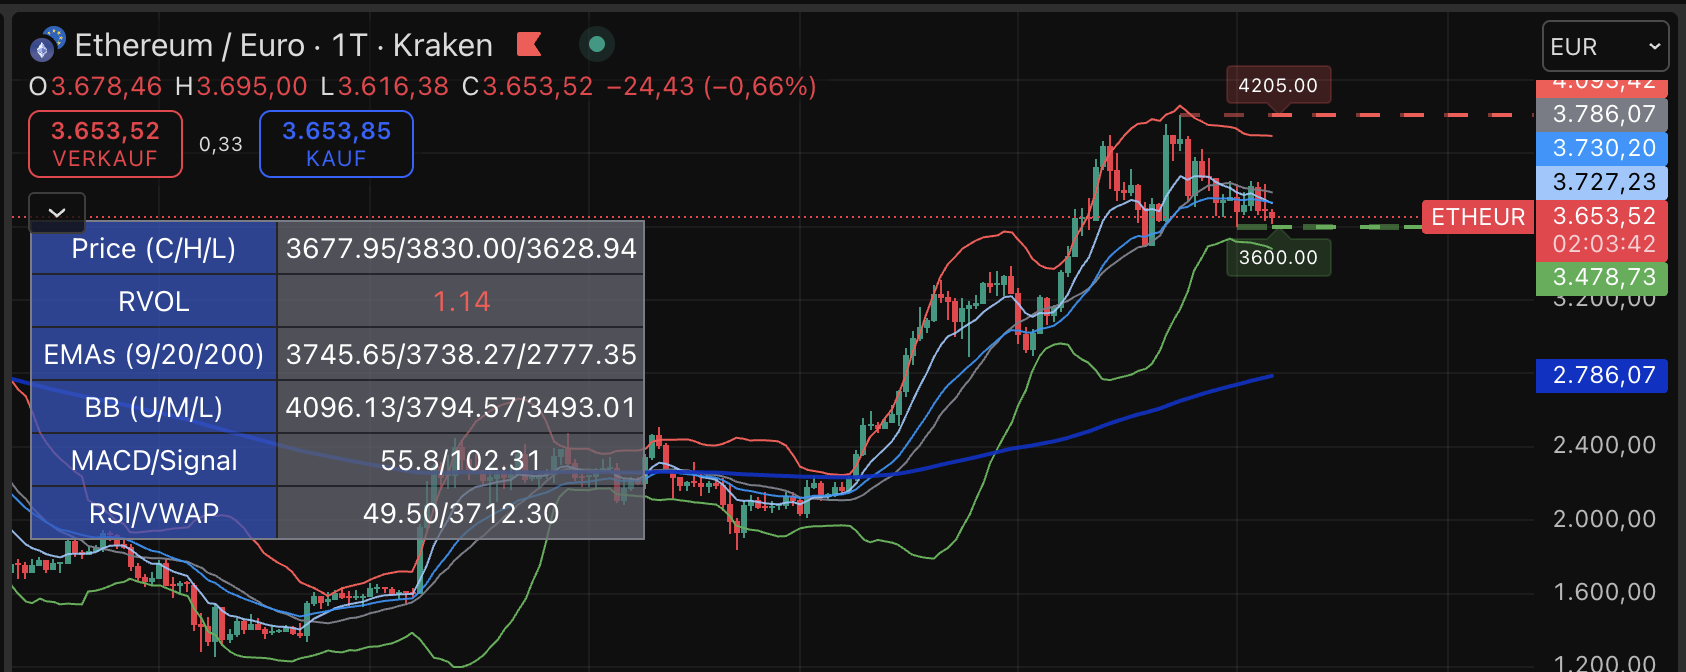
ChartLense Dashboard displaying key indicators in a clean table format on TradingView
Key Features
- Real-time Indicator Data - Live updates of key technical indicators
- Clean Table Format - Organized display that doesn't clutter your chart
- Pine Script Based - Native TradingView integration for optimal performance
- ChartLense Optimized - Designed to complement your ChartLense analysis
What Information Does It Show?
The ChartLense Dashboard provides:
- Key technical indicator values
- Market trend signals
- Important support/resistance levels
- Critical trading metrics
Detailed indicator specifications will be provided with installation instructions.
Benefits for TradingView Users
Quick Reference
- No need to add multiple indicators to your chart
- All essential data in one organized table
- Clean chart presentation without indicator overlays
Enhanced Analysis
- Complements ChartLense analysis
- Provides instant access to key metrics
- Supports faster trading decisions
Professional Display
- Organized, tabular format
- Minimal screen real estate usage
- Professional appearance for trading setups
Installation
Installation instructions and detailed setup guide coming soon.
Find ChartLense Dashboard in TradingView Extensions section.
Compatibility
- Platform: TradingView (all subscription levels)
- Requirements: TradingView account
- Integration: Works alongside ChartLense Chrome extension
Support
ChartLense Dashboard is designed to work seamlessly with the main ChartLense extension. For the best experience, use both tools together for comprehensive chart analysis.
→ Back to: Using ChartLense for the complete ChartLense experience