EMA Trading Strategy: Master Exponential Moving Averages
Learn how to use EMA trading indicators to identify trends, spot reversals, and time your entries. This comprehensive guide teaches you the 9, 20, and 200 EMA strategy - how these three exponential moving averages work together for crossover signals, divergence patterns, and trend confirmation. Perfect for beginners who want to master one of the most powerful technical analysis tools with real TSLA chart examples and an interactive video tutorial.
🎶 What is EMA? Welcome to the High-Tech Dance-Off!
You're at the hottest e-sports after-party. The arena pulses with holographic charts.
The Challenge: Three trackers must follow the Star Performer's every move – from lightning-fast spins to long-term flow. Each has their own speed and style.
Watch Mr. Hyper, Mr. Steady, and Mr. Zen track the Star Performer's "price" on the dance floor!
🕺 How EMA Works: Meet the 9, 20, 200 EMA Dynamic Trio
⭐ The Star Performer = Price Unpredictable moves. Quick spins, sudden dips. Never stops dancing.
🎧 The DJ/Analyst Watches everything. Helps you understand who's leading the dance.
🏃♂️ EMA 9 (Mr. Hyper) The Immediate Follower
- Dance Style: Mirrors every move, split-second behind
- Trading Power: Instant feedback on price momentum and quick reversals
🚶♂️ EMA 20 (Mr. Steady) The Groove Tracker
- Dance Style: Smooth flow, follows the main direction
- Trading Power: Medium-term trends, filters out noise
🧘♂️ EMA 200 (Mr. Zen) The Long-Term Observer
- Dance Style: Calm observation of the entire show
- Trading Power: Major trend direction, ignores daily volatility
📊 See Them Dance Live
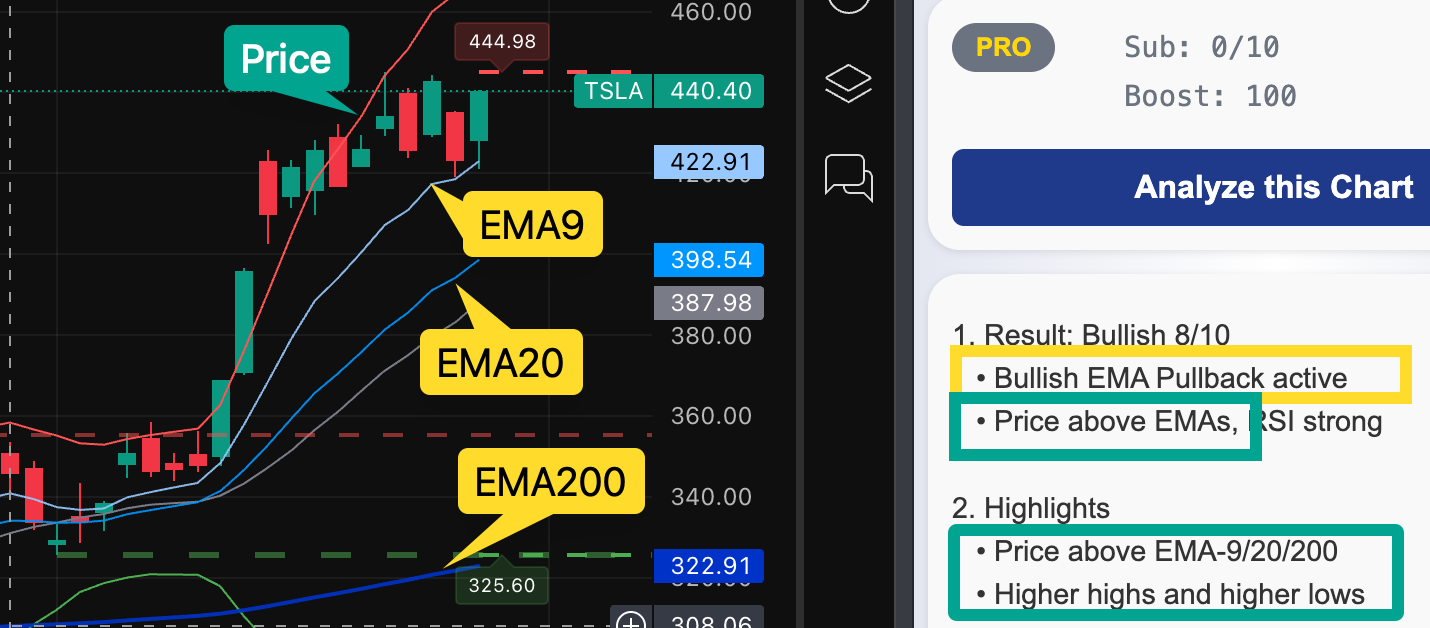
Live chart: Mr. Hyper (EMA9), Mr. Steady (EMA20), Mr. Zen (EMA200) all tracking the Star Performer. ChartLense confirms "Bullish 8/10" - price above all EMAs! © ChartLense
What You See in This TSLA Example:
- EMA9: ~$422, closest to price, immediate reactions
- EMA20: ~$398, smooth support level
- EMA200: ~$322, stable long-term base
The Bullish Signal: Price above ALL three EMAs = Strong uptrend confirmed!
🎬 EMA vs SMA: How Exponential Moving Averages Work
EMA = Exponential Moving Average Averages price over time but gives MORE weight to recent prices.
Why Different EMA Periods:
- 9-period EMA: Focuses on last 9 price points = Ultra sensitive to price changes
- 20-period EMA: Averages last 20 points = Balanced responsiveness for medium-term trends
- 200-period EMA: Averages last 200 points = Stable, long-term trend direction
How to Read EMA Trading Signals
📈 Trend Direction
- Price above EMAs = Bullish (upward dance)
- Price below EMAs = Bearish (downward dance)
⚡ Crossover Signals
- Fast EMA crosses ABOVE Slow EMA = BUY signal
- Fast EMA crosses BELOW Slow EMA = SELL signal
🔥 Power Combinations Combine EMAs with other tools for stronger signals:
- + Volume: High volume + crossover = more reliable
- + Support/Resistance: Crossovers at key levels = higher probability
- + MACD: Double confirmation = powerful signal (learn MACD basics)
⚠️ Remember: No indicator is perfect. Always use multiple confirmations.
🎭 EMA Divergence Strategy: Advanced Trading Signals
The Plot Twist: Sometimes the trackers disagree with the crowd. This signals a trend change coming.
Two Key Patterns:
💡 Pro Tip: Divergence is your early warning system – spot trend changes before they happen.
📚 Related Lessons
Continue your trading education with these complementary lessons:
MACD Basics
Combine MACD with EMAs for powerful momentum confirmation
Volume Analysis
Use volume to confirm EMA crossover signals and divergences