TradingView AI Extension: What It Does and How to Choose
An AI extension reads the chart you have open and explains it in words. Here is what that gives you, what it cannot do, and how to try one free.
What a TradingView AI extension does
Updated October 2026
TradingView shows you price, lines and indicators. It does not tell you what they mean. An AI extension adds a layer on top: it looks at the chart and writes a short explanation of the trend, the price levels that matter and the patterns it sees.
It is a reading aid. It does not trade for you, and it cannot see the future.
What a result looks like
Every result has the same layout: a verdict with a score out of 10, the setup it found, a confidence breakdown (trend, volume, catalyst, conviction, exhaustion) and key insights in plain English. You see the reasoning, not just a label. Read how each part of the result is built.
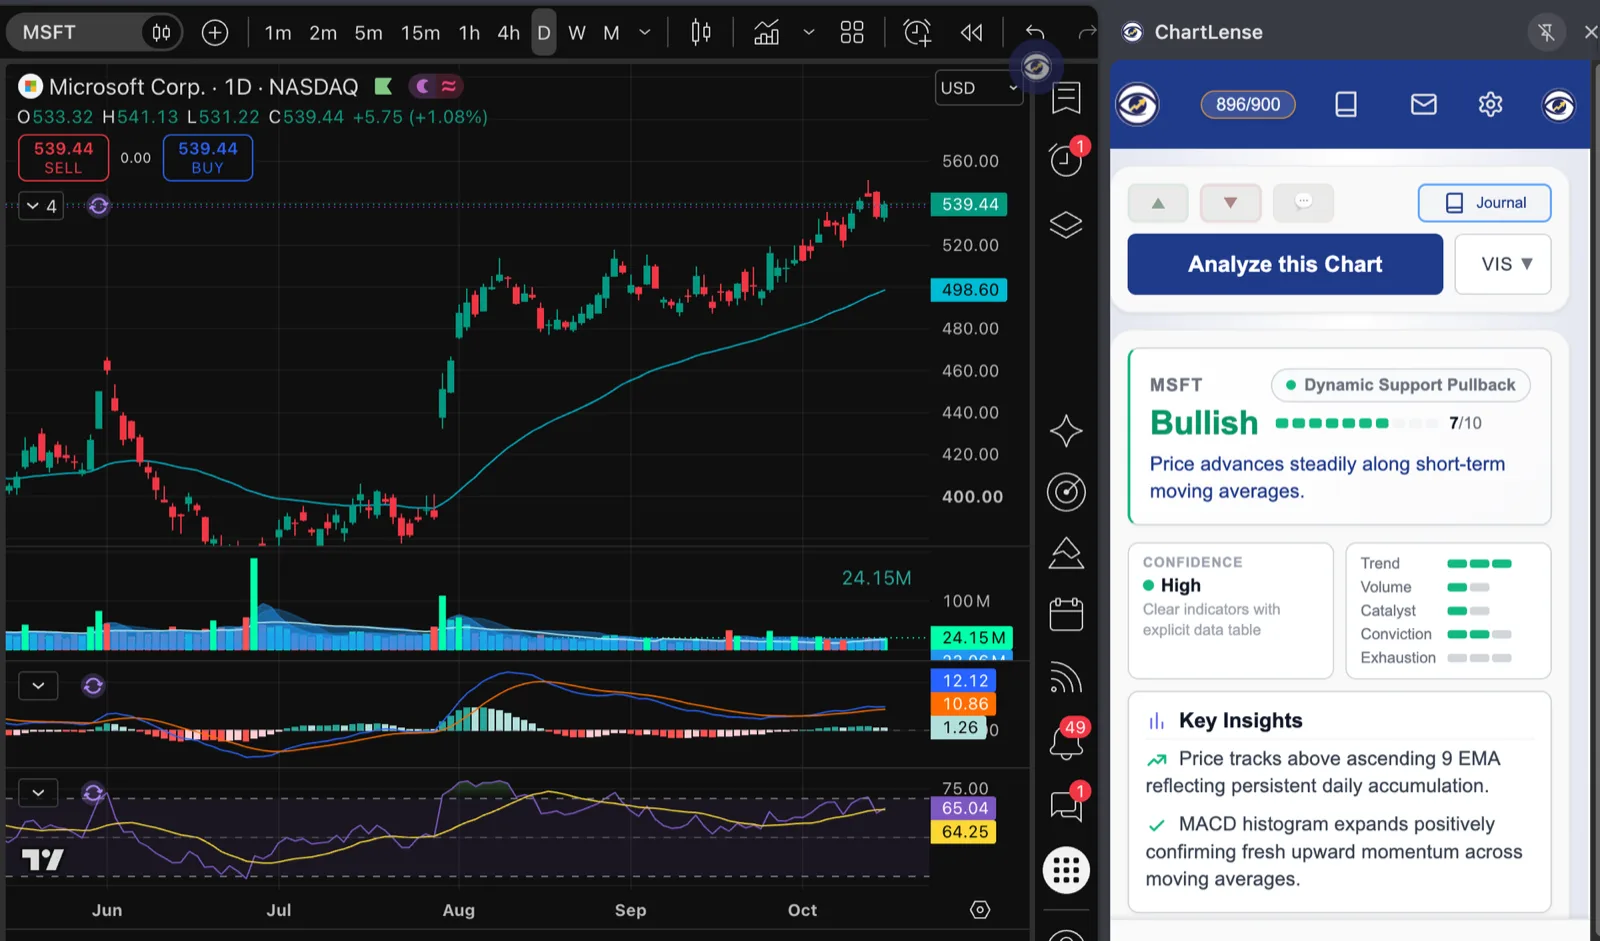
Example analysis of one chart on one day. Not a prediction or financial advice.
What to expect, and what not to
It can
- Describe the trend in plain words
- Mark support (where price tends to stop falling) and resistance (where it tends to stop rising)
- Name chart patterns and indicator readings
- Show how confident the read is
- Save each read so you can check it later
It cannot
- Predict where price goes next
- Place trades or connect to your broker
- Replace your own risk plan
- Be right every time. Many reads are neutral or low confidence, and the tool says so
How ChartLense works in TradingView
- 1Install. Add ChartLense from the Chrome Web Store and pin it to your toolbar.
- 2Open a chart. Go to TradingView and open any chart and timeframe you want a read on.
- 3Click the ChartLense icon. The sidebar opens. Sign in once to activate your free plan.
- 4Read the result. You get the trend, key levels, patterns, momentum and a confidence score, each explained in plain English.
ChartLense also works on Stock3, ProRealTime and Yahoo Finance, and on iPhone. See the iPhone app.
Optional: the free ChartLense Dashboard for TradingView
The Dashboard is a free TradingView indicator. It puts price, volume, moving averages, MACD, RSI and key levels in one table on your chart, so you can check the numbers behind an analysis.
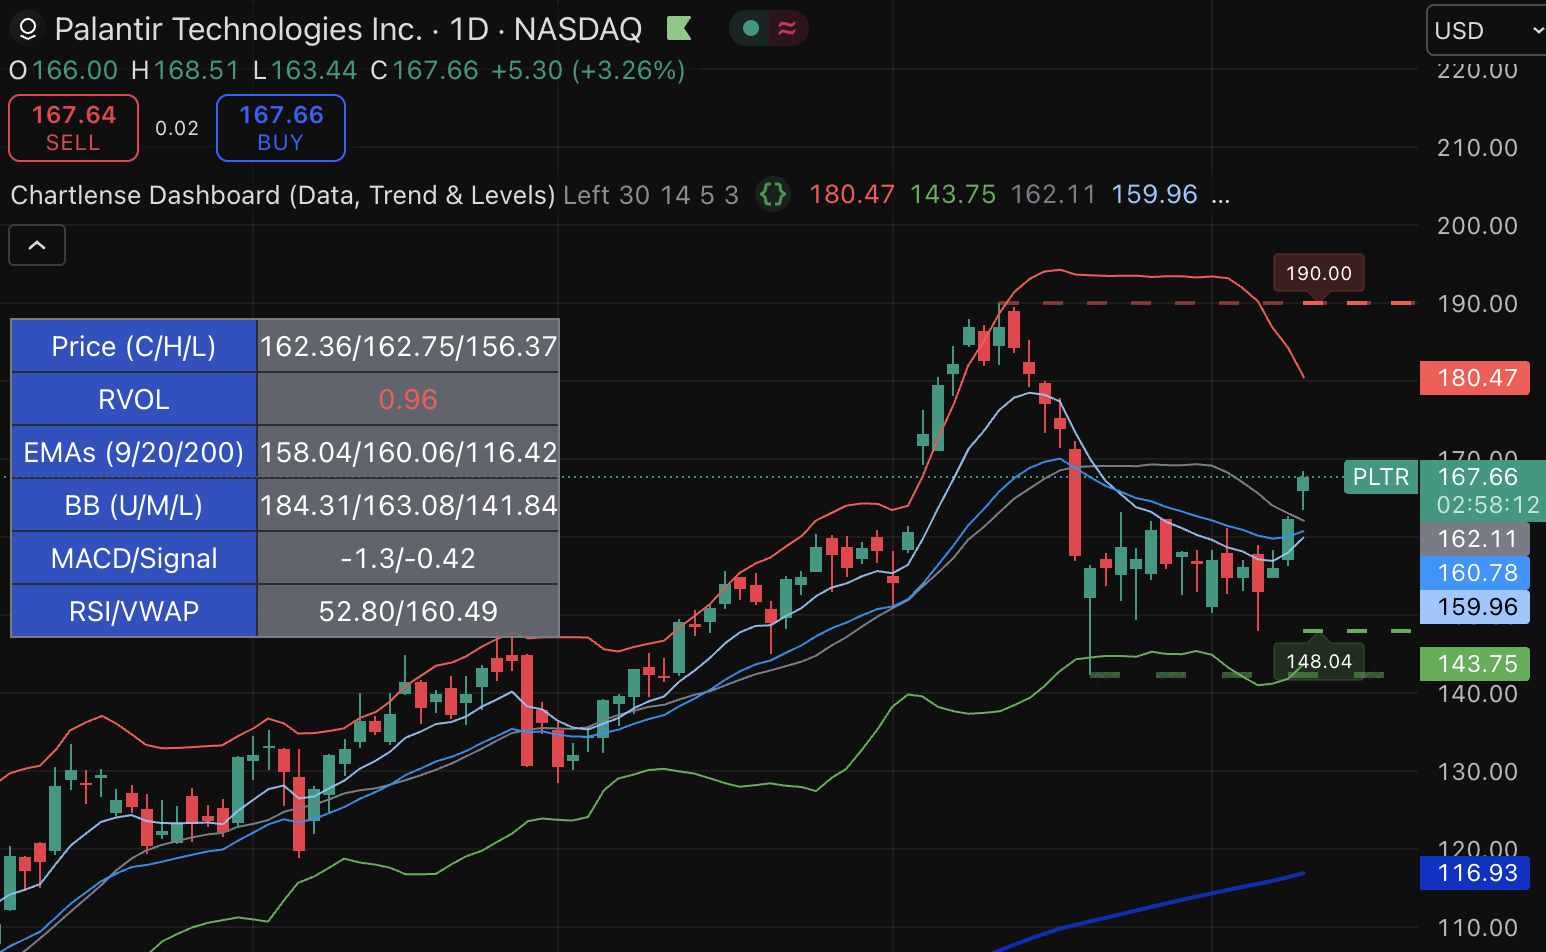
 Add the ChartLense Dashboard on TradingView
Affiliate link: we may earn a commission if you sign up to TradingView. It costs you nothing extra.
How to choose one
- Check the output. Look for a clear structure and plain language, not a wall of jargon.
- Check the limits. Good tools say when they are unsure. Be careful with any tool that sounds certain.
- Check the permissions and the maker. Read the Chrome Web Store listing and the privacy policy before you install.
- Check the price. Free tiers are fine for learning. Look at the daily cap.
For a side by side look, read the best TradingView AI extensions or the direct comparison with TradingView AI Chart Copilot. ChartLense is our product, so weigh our view with that in mind.
Frequently Asked Questions
What is a TradingView AI extension?
It is a browser add on that reads the chart you have open in TradingView and explains it in words. Most can describe the trend, mark support and resistance, and name patterns. Some also answer questions or set alerts.
Is ChartLense free to use in TradingView?
Yes. The free plan includes 5 analyses per day and needs no credit card. Paid plans start at $6.99 per month.
Does an AI extension tell me when to buy or sell?
No. It describes what the chart shows and how confident the read is. Treat it as a second opinion, not a signal. Many results come back neutral or low confidence, and that is useful information too.
Do I need to know technical analysis first?
No. ChartLense explains each term in plain English. Reading the explanations is also a fast way to learn what support, resistance and momentum mean.
Does it only work on TradingView?
No. It also works on Stock3, ProRealTime and Yahoo Finance, on other chart sites after a one time permission, and on iPhone from screenshots.
Which AI does ChartLense use?
ChartLense benchmarks models from OpenAI, Google Gemini and xAI Grok and uses the best performer, so the engine can change without you doing anything.
Try ChartLense Free
5 AI chart analyses per day, no credit card. Paid plans from $6.99 per month.
Add to Chrome for FreeChartLense provides educational chart analysis, not financial advice. Trading involves risk.