AI Trading Journal: Track & Export Trades
ChartLense includes a built-in visual trading journal for Chrome — no separate app needed. After every AI chart analysis, save the chart screenshot, AI-detected data, and your trade notes in one click. The AI automatically fills in the symbol, trend direction, pattern, and confidence score. Review your win rate, P&L, and export your full history as CSV.
Unlike standalone trading journal apps, ChartLense's journal is embedded in your analysis workflow. You never leave TradingView to log a trade.
What the Journal Does
Every journal entry captures a snapshot of your trading decision at the moment you made it:
- Chart Screenshot — visual record of exactly what you saw
- AI-Detected Data — symbol, timeframe, trend, pattern, and confidence filled in automatically
- Trade Parameters — direction (Long/Short), entry & exit prices, stop loss, take profit
- Live P&L Calculation — outcome and percentage calculated as you fill in prices
- Notes & Tags — your reasoning, trade thesis, and custom labels for filtering later
Your data is stored locally in the browser and synced to your account so you never lose it.
Saving a Trade to the Journal
Step 1: Analyze Your Chart
Run a chart analysis as you normally would. ChartLense captures a screenshot and generates AI insights behind the scenes.
After analysis, the Journal button in the toolbar becomes active and shows "Save to Journal".
Step 2: Open the Journal Modal
Click the Journal button. The modal opens on the New Entry tab with your chart screenshot at the top.
Step 3: Review the Auto-Filled Fields
ChartLense pre-fills as much as it can from the AI analysis:
| What's Detected | Where it Appears |
|---|---|
| Ticker symbol (e.g., BTCUSD) | Symbol field |
| Timeframe (e.g., 4H) | Timeframe field |
| Trend direction | Direction toggle (bullish = Long, bearish = Short) |
| Chart pattern (e.g., Double Bottom) | Info bar above the form |
| Analysis confidence | Info bar above the form |
| Trend + reasoning + pattern | Notes field |
| Timeframe, trend, pattern | Tags field (comma-separated) |
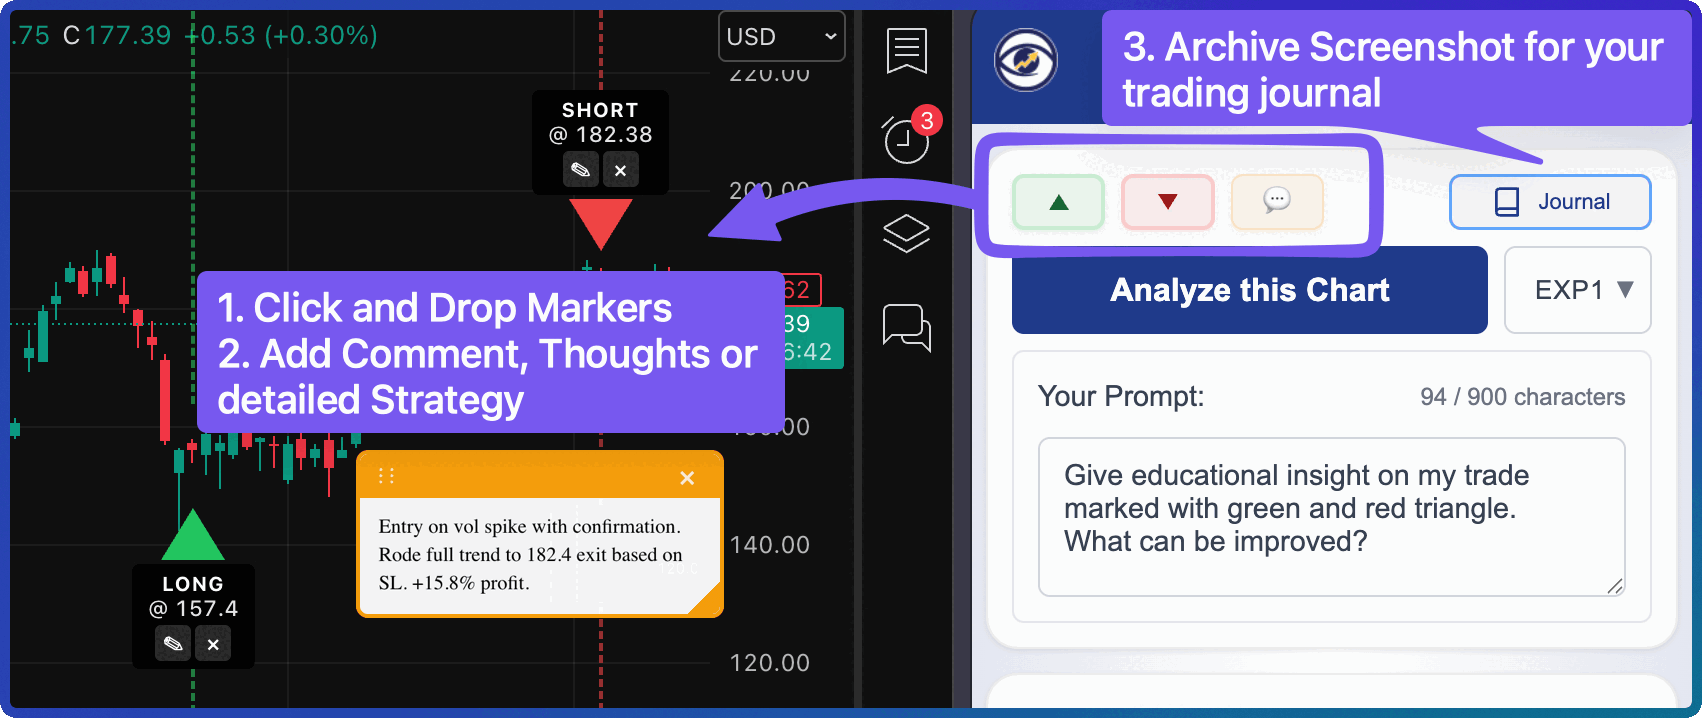
If you placed trade markers (Long/Short arrows) on the chart before saving, the marker prices auto-fill the Entry Price and Exit Price fields too.
Step 4: Complete the Entry
Fill in any remaining fields you care about:
- Direction — tap Long or Short to toggle
- Entry / Exit Price — as you type, a live P&L preview appears below showing percentage gain/loss and outcome (Win/Loss/Open)
- Stop Loss / Take Profit — optional, used for risk-reward ratio calculation
- Notes — add your trade thesis, reasoning, or anything you want to remember
- Tags — comma-separated labels (e.g.,
swing, breakout, earnings)
Step 5: Save
Click Save to Journal. Your entry is saved instantly and the modal switches to the History tab with your new entry highlighted at the top.
Tip: If you want to save just the screenshot without a journal entry, click Skip instead.
Viewing Your Trade History
You can open the history anytime — even without a new screenshot. If you have existing entries but no fresh analysis, clicking the Journal button opens directly to the History tab.
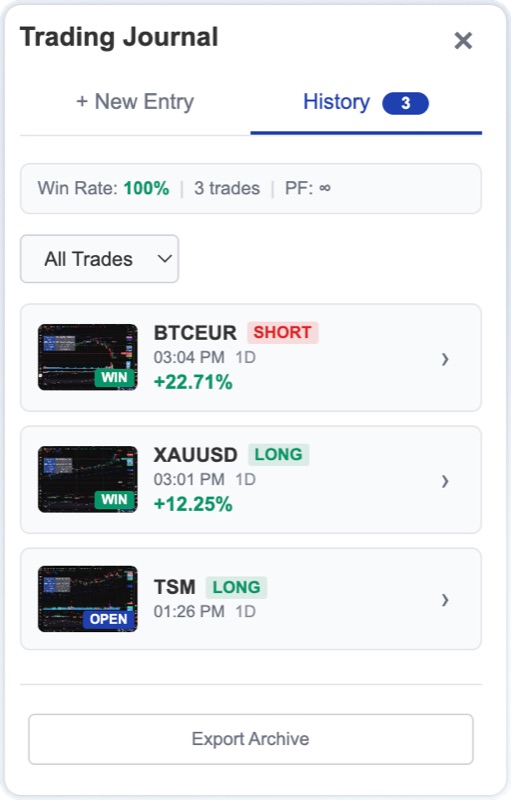
What You See
- Stats Bar — your overall Win Rate, total trade count, and Profit Factor at a glance
- Entry Cards — each entry shows a thumbnail, symbol, direction badge, date, timeframe, outcome, and P&L percentage
- Outcome Filter — filter by All, Win, Loss, Open, or Breakeven to focus on what matters
Entries are sorted newest-first. If you have more than 20 entries, a Load More button appears at the bottom to paginate through older trades.
Opening an Entry
Click any entry card to open the Detail View — a read-only modal showing:
- Full-size chart screenshot (click to open in a new tab)
- Symbol, direction, outcome, and P&L at the top
- Date, timeframe, and risk-reward ratio
- Price grid: Entry, Exit, Stop Loss, Take Profit
- Pattern, trend, confidence, and platform
- Your notes and tags
Detail View Actions
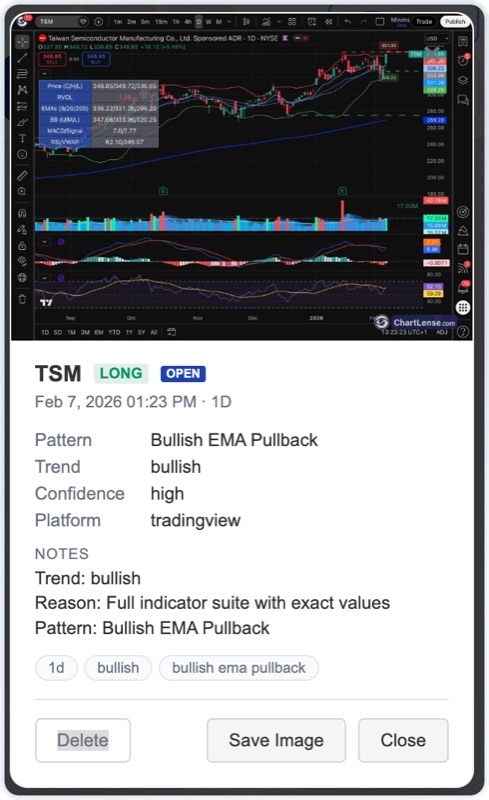
From the detail view you have three options:
Save Image
Creates an annotated screenshot with your trade data overlaid on the chart image (symbol, direction, outcome, P&L, date, pattern, notes) and downloads it as a JPEG file. The overlay sits at the bottom-left of the image so it doesn't cover the chart action.
The filename follows the format: ChartLense_{Symbol}_{Date}.jpg
Delete
Removes the entry. This uses a two-click confirmation — the first click changes the button to "Confirm?" and auto-reverts after 3 seconds if you don't confirm.
Close
Returns to the journal modal.
Exporting Your Journal
Click Export Archive at the bottom of the History tab to download your complete journal as a ZIP file containing:
- journal.csv — spreadsheet with all trade data (date, symbol, direction, prices, P&L, notes, tags, and more)
- screenshots/ folder — all chart screenshots as JPEG files, named by date, symbol, and direction
The CSV includes clickable links to the matching screenshot files, so you can open the relevant chart image directly from your spreadsheet.
The filename follows the format: ChartLense_Journal_{Date}.zip
How Syncing Works
Your journal is designed to work seamlessly across sessions:
- Entries are saved locally first — there's no loading delay when you open the journal
- Backend sync happens in the background — each save and delete is silently pushed to your account
- On login, missing entries are restored — if you used ChartLense on another device, entries sync back automatically
- Screenshots stay on your device — only trade metadata (no images) is synced to the cloud, keeping sync fast and storage lean
You can use the journal offline. Entries created offline will sync the next time you're online and logged in.
Best Practices
- Save every setup you act on — even trades that don't work out are valuable learning data
- Use the notes field — write your reasoning at the time of the trade, not after the fact
- Tag consistently — use repeating tags like
swing,breakout,earnings,scalpso you can filter later - Review weekly — filter by "Loss" to spot recurring mistakes; filter by "Win" to reinforce what works
- Export monthly — download your archive for backup or to analyze in a spreadsheet
- Fill in exit prices after closing — come back and update entries to get accurate P&L tracking
Limits
| Limit | Value |
|---|---|
| Maximum entries | 200 (oldest removed automatically when exceeded) |
| Screenshot quality | Compressed for storage efficiency (max 800px width) |
Ready to track your trades? Open ChartLense on any chart, run an analysis, and click Journal to save your first entry.
Related: Using ChartLense | Getting Better Results | Privacy Settings